Next Generation Spectral Library
Available Formats
The intrinsic dispersion of the STIS low resolution gratings varies
from 1.37Å per pixel in the UV to 4.86Å per pixel in the
red. Some users will find it easiest to deal with each star
as a single file with a single dispersion, while others will prefer to
work with the data in its "as observed" dispersion. And some will
want fits files, others ascii tables.
In an effort to please (most) everyone, we plan to make the spectra
for each star available in these formats:
1) One fits
image
with a linear dispersion of 1.37Å per pixel
over the wavelength range 1670Å to 10200Å. This multispec
file can be viewed in iraf with splot, etc.
Here is an example fits image.
1a) A two-column ascii table of the data in the fits image in (1),
listing the wavelengths and fluxes, plus a prepended fits header.
Here is an example text file.
2) A trio of multispec fits images for each star, suitable for splot
viewing, one for each of the STIS gratings, G230LB, G430L, and G750L.
These fits spectra have a linear dispersion which is very close to the
natural dispersion of the raw data. These multispec files also
include "bands" with the total counts, the background, and an error
array produced by the CALSTIS routines. Our pipeline at this time
does not subtract any background, so the background (band 3) is all
zeroes.
Here are three examples,
G230LB ,
G430L , and
G750L .
These spectra are presented "as extracted" by the CALSTIS software, so
the ends can be somewhat noisy. The noisy parts are clipped by our
pipeline when producing the final spectra in (1) and (1a). Users who
download the individual grating spectra are advised to use their
judgment. If there is sufficient demand, we can clean up these
spectra for distribution, but feel at this time that a bit of reality
is not a bad thing.
2a) The three spectra in (2) can easily be turned into text files, as
was done in (1a), but we leave this up to the user. If this is a
hardship for anyone, we will do it and make them available, though it
would quadruple the number of files and links we would have to
maintain.
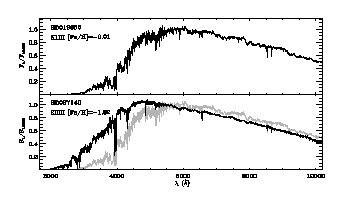
3) If you are interested in just a few stars, informative postscript plots of individual
objects can be viewed or downloaded. In this example plot, one can
clearly see the effects of the red contamination in the extreme UV
where the spectrum turns up.
4) The whole lot of (1), (1a), or (2) can be downloaded as gzipped tar
files.
When the library reaches completion, the spectra will be
parsed by abundance into the four [Fe/H] ranges:
-2.0 < [Fe/H] < -1.5
-1.3 < [Fe/H] < -0.5
-0.3 < [Fe/H] < +0.1
and
[Fe/H] > +0.2.
and made available as four separate libraries. For now, we simply
supply in each spectrum a header keyword indicating the published
metallicity that we assumed in choosing the star for the library.
Header Information
Eventually, header keywords will be added to indicate the adopted
[Fe/H], log(g) and T_eff. These values will be refined and homogenized
as analysis of the spectra proceeds.
We will also add header information providing the observed V
magnitude, various broad band colors determined from the STIS spectra,
the Hipparcos parallax, the Hipparcos catalog number, the absolute V
magnitude, proper motion, and RA and Dec, and other useful information.
Last modified February, 2004
Please report any problems or comments to:
gregg@igpp.ucllnl.org